Examples
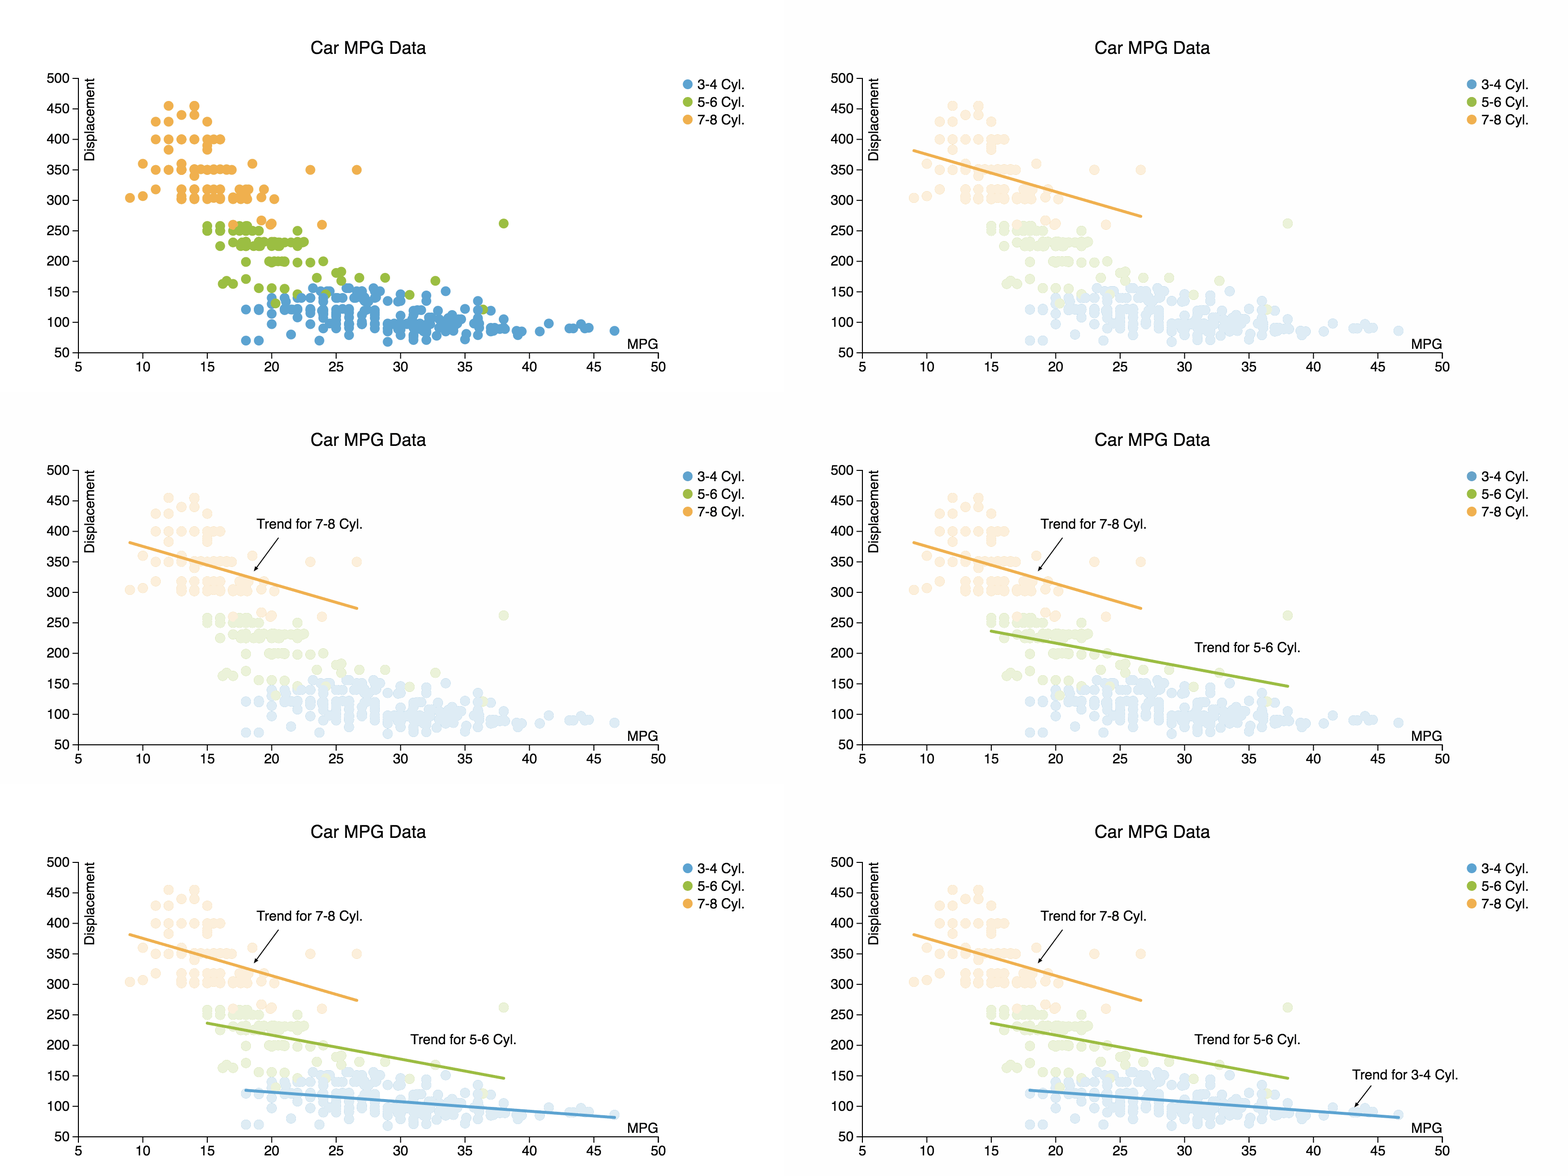
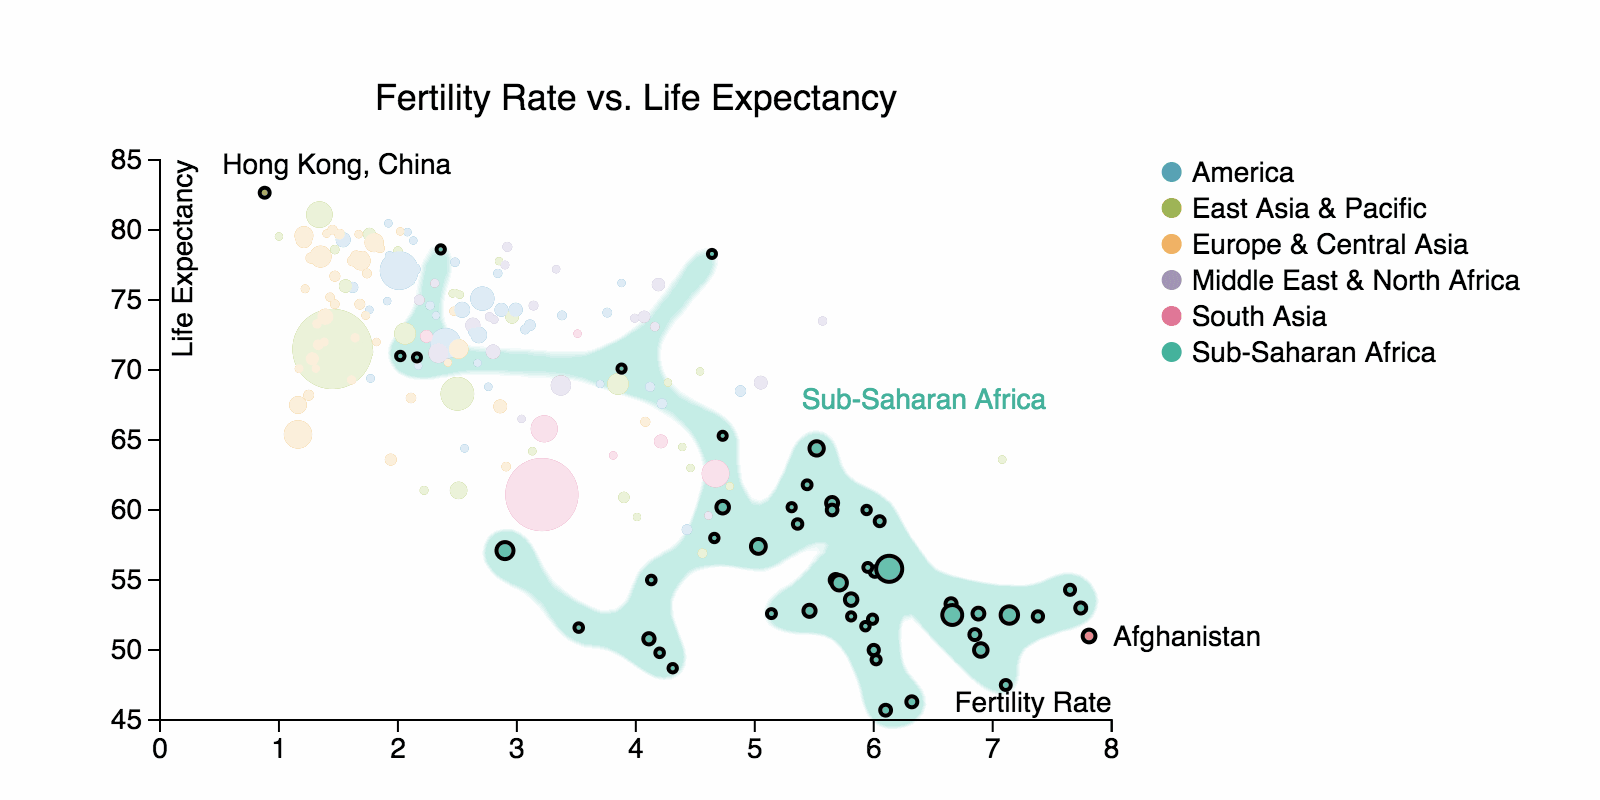
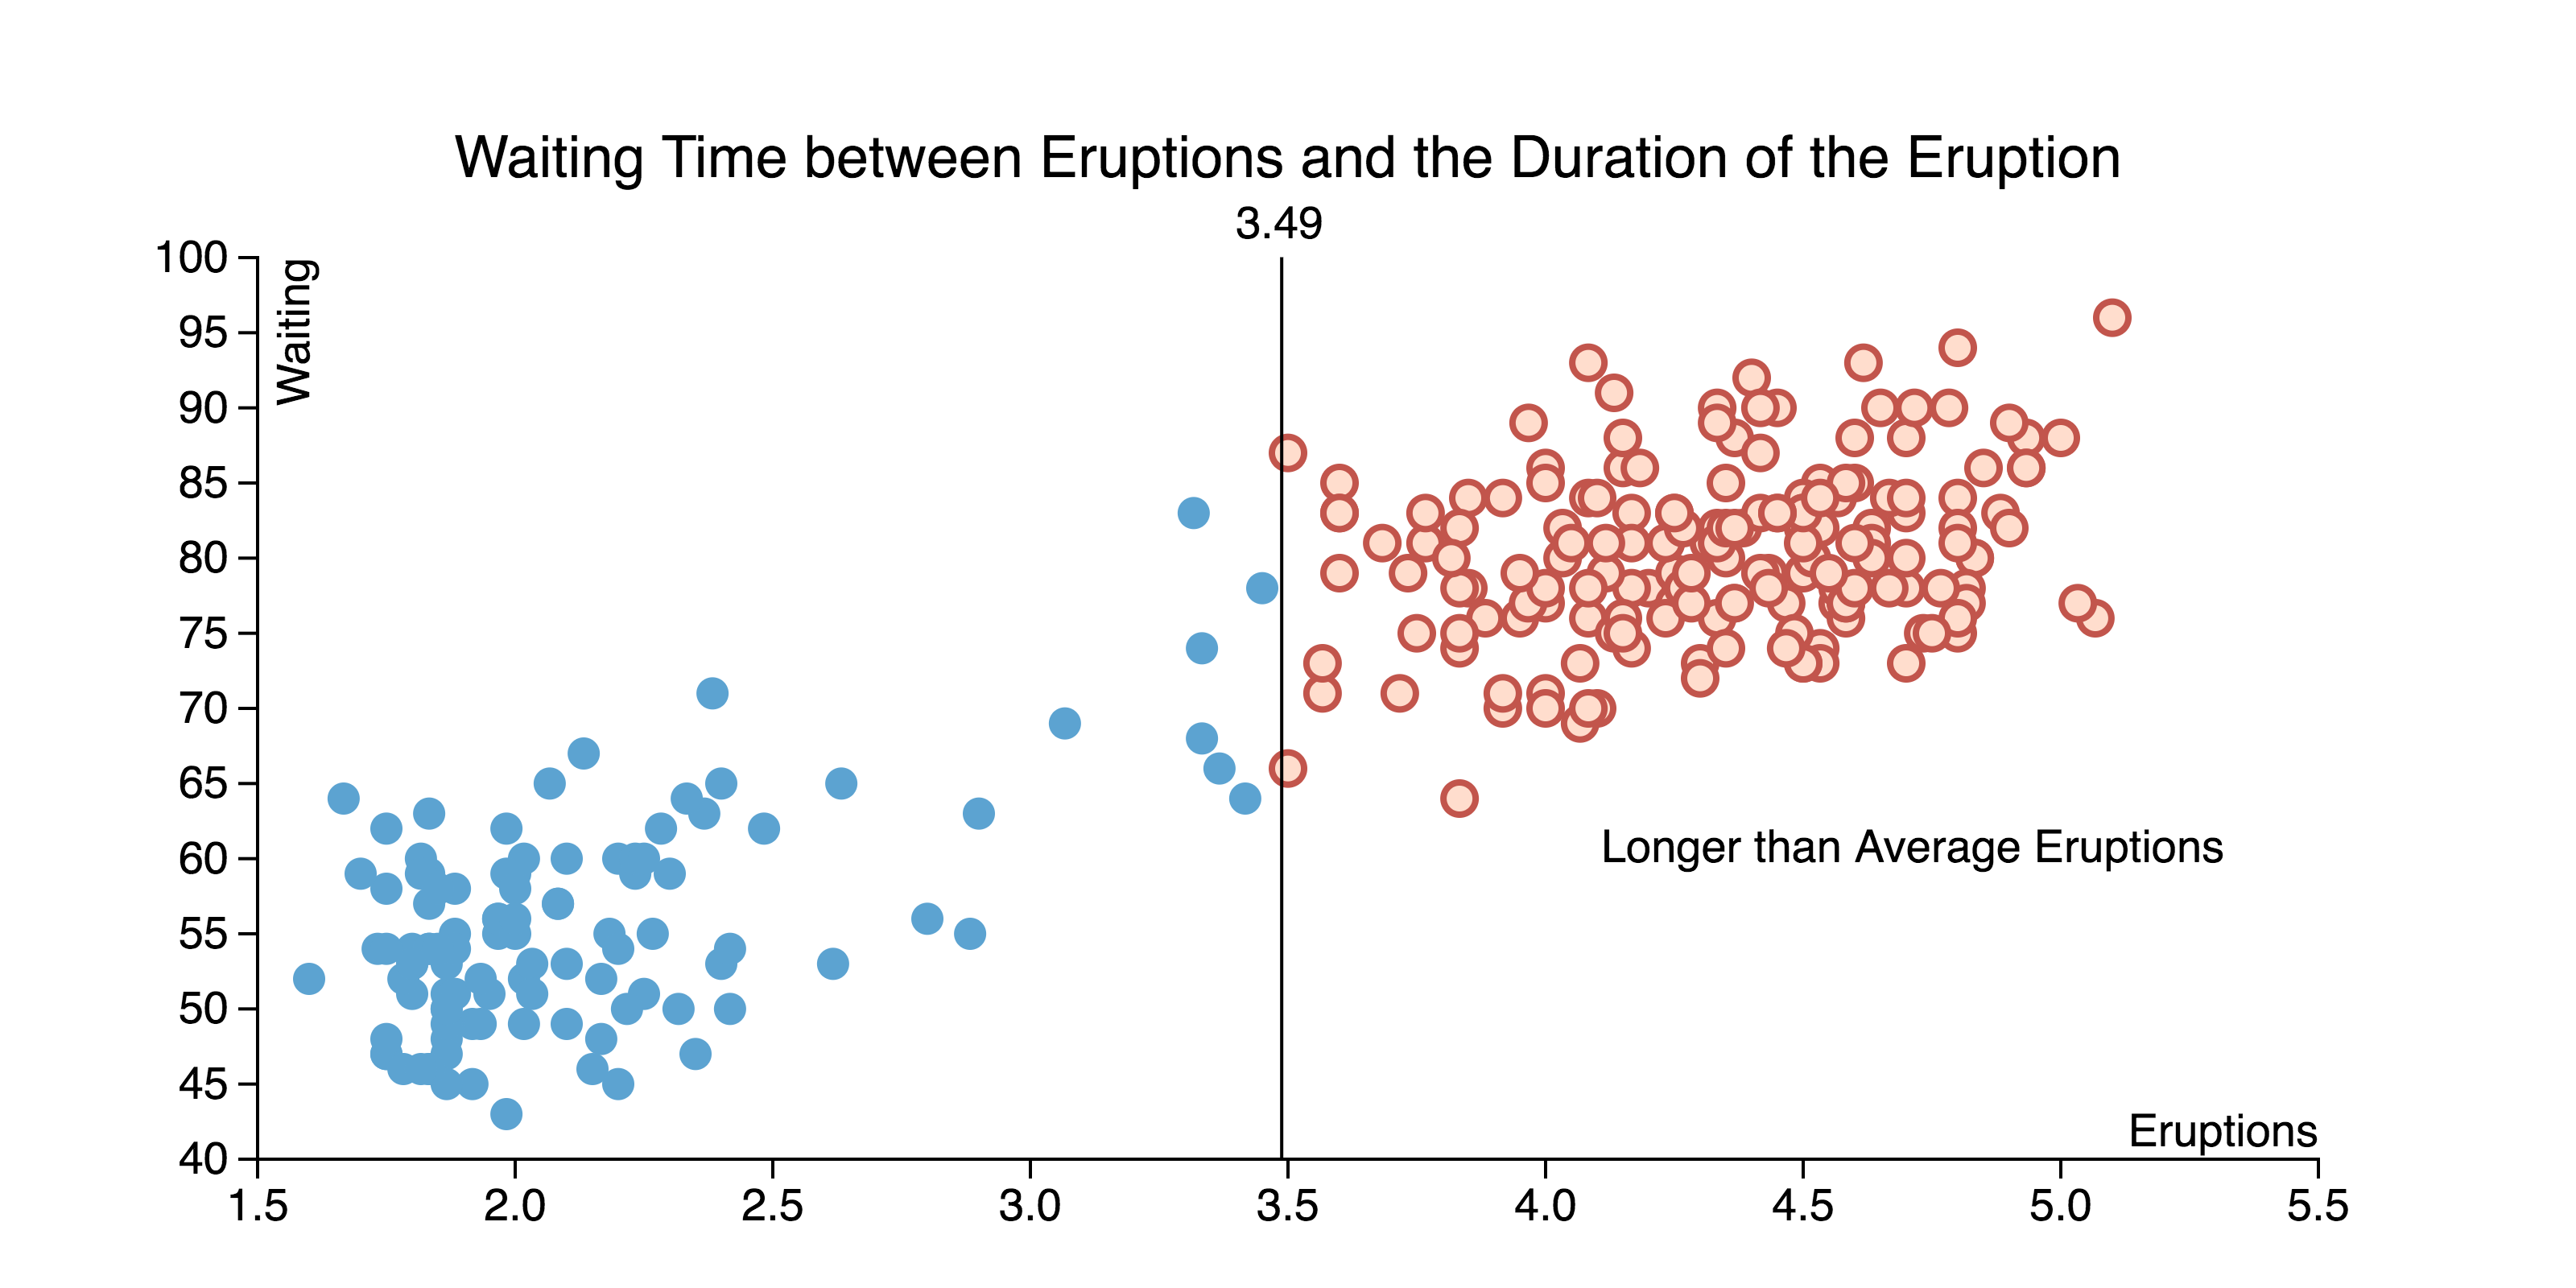
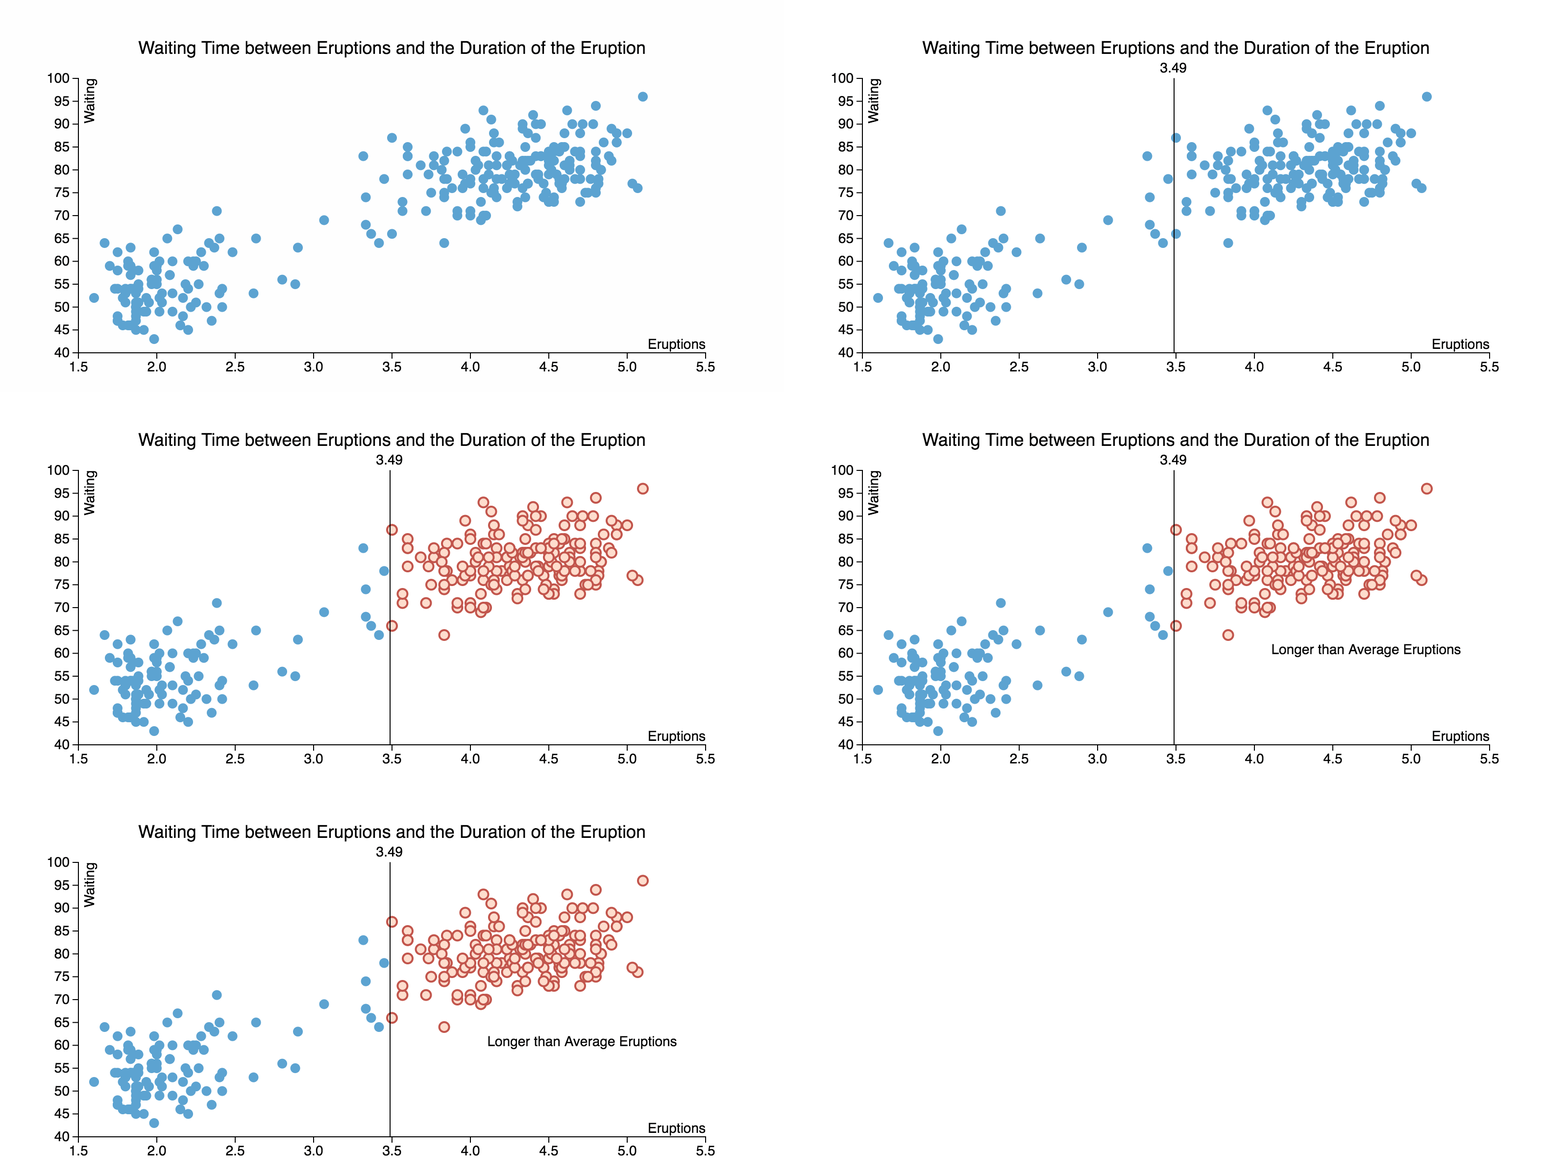
Created and annotated with ChartAccent
Annotating with ChartAccent
Create and modify an annotation in just three steps
(1) Select an annotation target
- Direct selection: Hover to highlight an annotation target. Click to select and annotate
a target; mouse drag, lasso, or click while holding CTRL or SHIFT keys selects multiple targets.
- Indirect selection: Click on a legend item to annotate a series of items that share
the same categorical attribute value.
- Direct range selection: Select a point or a region between two points along an axis,
and these range selections trigger a default shape annotation.
- Range editing: Adjust the position or range using ChartAccent's range target editor,
which allows you to compose basic formulas that can reference the attributes of the dataset.
The editor features auto-complete support and includes a set of basic statistical functions including
minimum, maximum, mean, and median.
- Indirect range selection: Upon selection of a range target annotation, you can
select data items above or below the range. This selection is tightly coupled with the original
range target; if the range annotation is adjusted, ChartAccent automatically updates any
associated selections of data items above or below the range.
(2) Add additional annotation forms
- Default annotation forms: When you select an annotation target, ChartAccent applies
the default annotation form depending on the target. The default annotation for a data item is
a black stroke border and a text annotation indicating the item's value, which appears adjacent
to the item. Single attribute range targets trigger line or rectangle annotations in response
to a click or drag along an axis, respectively.
- Other annotation forms: You can also add text, image, and shape annotations to chart
elements; these shape annotations include lines, arrows, ellipses, and rectangles.
(3) Modify the visual properties of the annotation
- Control panel: Use ChartAccent's control panel for modifying the visual properties
of annotation. Annotations for sets and series of data items share the same visual properties,
so each item in a set or series does not need to be modified individually. Annotation properties
include font properties such as type, size, and color, the visibility of a dropline connecting
an annotation to its target, as well as stroke and fill properties.
Survey
A corpus of 106 annotated charts from six news graphics desks, labeled with the dimensions of our design space.


